Sections
Background
Since 2011, ICNARC has published the Annual Quality Report for the Case Mix Programme (CMP). The Annual Quality Report makes results from the CMP public to provide a valuable insight into the quality of NHS adult, general critical care both overall, and at the following levels:
- Region (England or Wales - Units in Northern Ireland have chosen not to participate in the report)
- Critical Care Network*
- Trust or Health Board
- Hospital
- Individual critical care unit
97% of all adult, general critical care units in England, Wales and Northern Ireland now participate in the CMP. Following rigorous data validation, all participating units receive regular, quarterly comparative reports for local performance management and quality improvement.
*NHS organisation structure correct for reporting period
Publication process
The Case Mix Programme (CMP) Annual Quality Report follows a clear publication process:
- All participating NHS adult, general (ICU, ICU/HDU) critical care units who have collected and submitted data from the period 1 April to 31 March of the reporting year are identified
- These units have been asked to agree to public disclosure of their results and have been given the option to consent (or not) to this disclosure
- To obtain consent, ICNARC has requested signatures from both the Clinical Director of each participating unit, as well as from the Chief Executive of the Trust
- If analysis reveals a participating unit with a potential outlier, ICNARC follows a clear 'Detection and management of outliers' policy (see Appendix: Managing outliers)
For the purposes of analysis, the database was locked on 3 October 2014. Data received and/or validated after this date are not included in this report but will be included in the subsequent periodic update.
Participation and coverage
Eligibility criteria for inclusion in the Annual Quality Report for NHS adult, general critical care units for 2013/14 are as follows:
- Adult, general critical care units (ICU, ICU/HDU) located in NHS hospitals in England, Wales and Northern Ireland participating in the Case Mix Programme (CMP)
- Have submitted at least six months of data for the period 1 April to 31 March of the reporting year
- Have fully completed the first cycle of data validation (by means of a first Data Validation Report)
(all data are updated six months after original publication, with fully validated data, where applicable) - Formal, signed consent from the Clinical Director of the critical care unit and the Chief Executive of the Trust
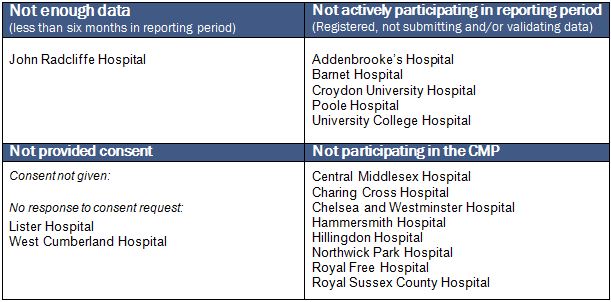
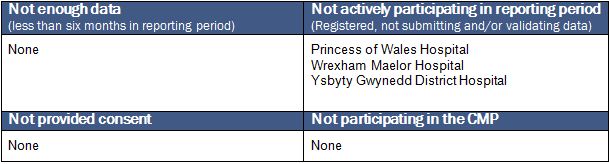
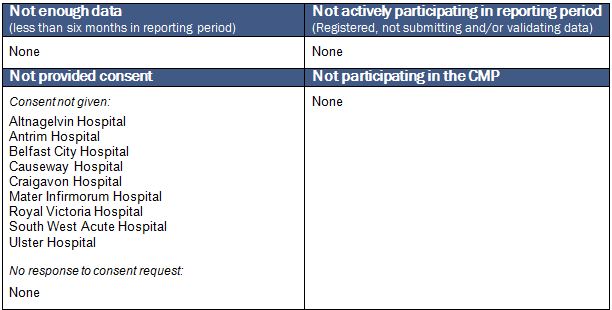
93% of critical care units that participate in the CMP are eligible for inclusion in the Annual Quality Report 2013/14. Critical care units that are not eligible, along with units that were not participating in the CMP on 31 March 2014, are listed by country below.
England
Wales
Northern Ireland
Navigating this report
To search for a required unit/site and results, use the toolbar and search facility at the top of each page. Toggle between 'Region' or 'Network' to select different paths through the Report.
Search for your unit or site via: Region (England or Wales), Network, Trust (or Health Board), Hospital or Unit.
Please note: NHS organisation structure correct for reporting period
Once you have selected a site (including ‘all’), you can view results for each potential quality and participation indicator as follows:
- Click through each results tab
- View results graphically. For more information about the graphs used in this report, see Appendix: Presentation of results
- View the denominators behind the graphs, as well as definitions for each potential quality indicator in the accompanying text under each graph
Quality indicators
The Annual Quality Report currently reports on 12 potential quality indicators.
ICNARC has developed several new potential quality indicators for this Annual Quality Report.
Some potential quality indicators provided in previous Annual Quality Reports have been amended or replaced by indicators prescribed by the Clinical Reference Group for adult critical care in relation to specialised commissioning (see Appendix: Clinical Reference Group (CRG)).
The potential quality indicators reported in the Annual Quality Report are as follows:
Hospital mortality – risk adjusted (ICNARC and CRG indicator)
- Hospital mortality is defined as death before ultimate discharge from acute hospital
- A mortality ratio is calculated by dividing the observed by the expected acute hospital mortality, with the expected estimated by a risk prediction model, a mortality ratio is one (1.0) when the observed and expected acute hospital mortality are equal
- The ICNARC model was developed and validated using Case Mix Programme (CMP) data and is regularly recalibrated to ensure accuracy
- The ICNARC risk prediction model describes the relationship between case mix factors (from the first 24 hours following admission to an NHS adult, general (ICU, ICU/HDU) critical care unit) and hospital mortality
- The ICNARC model estimates the expected number of acute hospital deaths for an NHS adult, general critical care unit based on the case mix of its admissions
Hospital mortality – risk of death < 20% (ICNARC indicator – new for 2013/14)
- Definition as per ‘Hospital mortality’
- Divides the observed number of deaths where risk of death is less than 20% by the expected number of deaths where risk of death is less than 20%, using the current ICNARC models
Hospital mortality – risk of death ≥ 20% (ICNARC indicator – new for 2013/14)
- Definition as per ‘Hospital mortality’
- Divides the observed number of deaths where risk of death is greater than or equal to 20% by the expected number of deaths models where risk of death is greater than or equal to 20%, using the current ICNARC models
Unit-acquired Methicillin-resistant Staphylococcus aureus (MRSA)
- Presence of MRSA in any sample taken for microbiological examination after 48 hours following admission to the NHS adult, general critical care unit – reported as the rate per 1000 patient days among all patients staying at least 48 hours and excluding those with admission MRSA or no samples taken
- The comparator value is the overall rate of unit-acquired MRSA from all NHS adult, general critical care units in the CMP for the time period of the report
Unit-acquired infection in blood (CRG indicator)
- Presence of an infection in any blood sample taken for microbiological culture after 48 hours following admission to the NHS adult, general critical care unit (does not include micro-organisms grown from line tip cultures, the same micro-organism cultured repeatedly for the same patient, or infection with Coagulase-negative Staphylococcus) – reported as the rate per 1000 patient days among all patients staying at least 48 hours
- The comparator value is the overall rate of unit-acquired infections in blood from all NHS adult, general critical care units in the CMP for the time period of the report
Non-clinical transfers (out) (ICNARC and CRG indicator)
- Critical care unit survivors discharged for comparable critical care to a Level 3 bed in an adult ICU or ICU/HDU in another acute hospital – reported as the percentage of all critical care unit admissions
- The comparator value is the overall percentage of non-clinical transfers (out) from all NHS adult, general critical care units in the CMP for the time period of the report
Out-of-hours discharges to the ward (CRG indicator)
- Critical care unit survivors discharged to a ward in the same hospital between 22:00 and 06:59 – reported as the percentage of all critical care unit survivors discharged to a ward in the same hospital
- The comparator value is the overall percentage of out-of-hours discharges to the ward in all NHS adult, general critical care units in the CMP for the time period of the report
Daytime discharges to the ward (CRG indicator)
- Critical care unit survivors discharged to a ward in the same hospital between 07:00 and 21:59 – reported as the percentage of all critical care unit survivors discharged to a ward in the same hospital
- The comparator value is the overall percentage of daytime discharges to the ward in all NHS adult, general critical care units in the CMP for the time period of the report
- Please note this potential quality indicator is not included on the CMP Quality Indicator dashboard
Out-of-hours discharges to the ward (not delayed) (ICNARC indicator)
- Critical care unit survivors discharged to a ward in the same hospital between 22:00 and 06:59 who are not delayed i.e. not declared fully ready for discharge by 18:00 on that day – reported as the percentage of all critical care unit survivors discharged to a ward in the same hospital
- The comparator value is the overall percentage of out-of-hours discharges to the ward (not delayed) in all NHS adult, general critical care units in the CMP for the time period of the report
Delayed discharges (12 hour delay) (ICNARC indicator – new for 2013/14)
- Number of bed days utilised by critical care unit survivors with a delay of 12 hours or more between reported time when fully ready for discharge and time of discharge, once the delay has surpassed 12 hours – reported as the percentage of all available critical care bed days
- The comparator value is the overall percentage of critical care bed days utilised by delayed discharges (12 hour delay) in all NHS adult, general critical care units in the CMP for the time period of the report
- Please note this potential quality indicator is not presented as a funnel plot
Delayed discharges (24 hour delay) (ICNARC and CRG indicator)
- Number of bed days utilised by critical care unit survivors with a delay of 24 hours or more between reported time when fully ready for discharge and time of discharge, once the delay has surpassed 24 hours – reported as the percentage of all available critical care bed days
- The comparator value is the overall percentage of critical care bed days utilised by delayed discharges (24 hour delay) in all NHS adult, general critical care units in the CMP for the time period of the report
- Please note this potential quality indicator is not presented as a funnel plot
Unplanned readmissions within 48 hours (ICNARC and CRG indicator)
- Critical care unit survivors discharged to a ward in the same hospital that are subsequently readmitted to the same NHS adult, general critical care unit within 48 hours of discharge and the subsequent admission is classified as unplanned – reported as the percentage of all critical care unit survivors discharged to a ward within the same hospital
- The comparator value is the overall percentage of unplanned readmissions within 48 hours in all NHS adult, general critical care units in the CMP for the time period of the report
Other results included in the Annual Quality Report:
Active participation
- Case Mix Programme participation is based on NHS adult, general critical care units participating in the CMP during the time period of the report – reported as the percentage of the possible NHS adult, general critical care unit(s) within the selection
- Available data are based on eligible (see Introduction: Participation and coverage) units with data for each quarter – reported as the percentage of all participating unit(s) within the selection
Data completeness
- Data completeness is based on all admissions to the selection
- Indicates the level of completeness of data in all fields used to calculate each potential quality indicator
Potential quality indicators are presented:
- together on a single 'dashboard' with appropriate comparator and threshold values indicated
- individually on a funnel plot
See Appendix: Presentation of results for more information.
Contact us
For questions or feedback on or about this Annual Quality Report, please contact ICNARC via email: cmp@icnarc.org
For further information on the Case Mix Programme or any other ICNARC activities, visit our website:
www.icnarc.org