Sections
Eligibilty
Eligibility criteria for inclusion in the Case Mix Programme (CMP) Annual Report 2010/11 are as follows:
- Adult, general critical care units (either ICU or combined ICU/HDU) located in NHS hospitals in England, Wales and Northern Ireland participating in the CMP
- At least six months of validated data for the period 1 April 2010 to 31 March 2011
- Formal, signed consent from the Clinical Director of the critical care unit and the Chief Executive of the Trust
CMP data
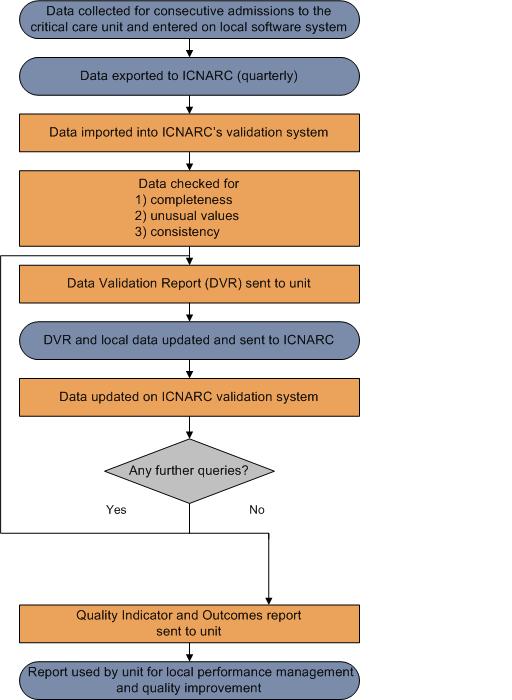
An overview of the Case Mix Programme (CMP) audit process for the collection, submission, validation, analysis and reporting of CMP data is described below:
CMP data processing
An overview of the Case Mix Programme (CMP) process for the collection, entry, submission, validation, analysis and reporting of CMP data is shown in the diagram below:
Presentation of results
Quality indicators are presented in a funnel plot format.
As the number of admissions increases, the precision with which a result can be calculated increases.
- Example – Hospital Mortality
As the number of admissions increases, the precision with which the mortality ratio can be calculated increases and so, if the model is perfectly predicting hospital mortality, we expect the points to form a funnel shape centred on a mortality ratio of one (1.0).
The grey lines represent control limits at 2 standard deviations (dashed line) and 3 standard deviations (solid line).
If the variation between results is random then on average 95% of points should lie within the inner control limits (2 standard deviations) and 99.8% should within the outer control limits (3 standard deviations).
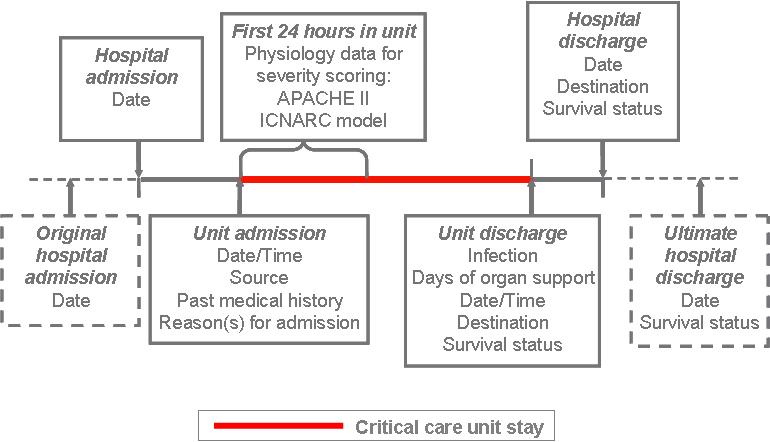
ICNARC risk prediction model
The ICNARC risk prediction model was developed using data from over 200,000 admissions in the CMP Database (Harrison et al, 2007). Regular recalibration ensures that each critical care unit is being compared with current CMP data. ICNARC (2011) model is the latest recalibration.
Risk predictions in the ICNARC (2011) model are based on:
-
ICNARC Physiology Score – a score from 0 to 100 based on weightings for deviations from normal for the following 12 physiological measures during the first 24 hours in the unit
- Heart rate
- Systolic blood pressure
- Temperature
- Respiratory rate
- PaO2/FiO2 ratio
(with differential weightings if ventilated during the first 24 hours in the critical care unit) - Arterial pH
- Serum urea
- Serum creatinine
- Serum sodium
- Urine output
- White blood cell count
- Glasgow Coma Score
(with additional weightings for patients sedated or paralysed during the first 24 hours in the critical care unit)
-
Age at admission to the critical care unit
-
Reason for admission to the critical care unit
-
Interactions with the ICNARC physiology score and reason for admission
-
Receipt of Cardiopulmonary resuscitation (CPR) within 24 hours prior to admission
-
Location in hospital prior to admission to the critical care unit
Exclusions
The following are excluded from comparisons of observed and expected mortality:
- Subsequent admission(s) (i.e. readmissions), within the same acute hospital stay
- Admissions missing data on status at discharge
Reference
Harrison DA, Parry GJ, Carpenter JR, Short A, Rowan K. A new risk prediction model for critical care: the Intensive Care National Audit & Research Centre (ICNARC) model. Crit Care Med 2007; 35:1091–8.
Detection and management of outliers
Purpose
An outlier is a result that is statistically significantly further from the expected comparator value than would usually occur by chance alone.
This policy has been developed to ensure that potential outliers are identified through the processes of national clinical audit. The policy sets out the actions that ICNARC takes when data indicate that results for a site significantly deviate from the expected value.
This policy is based on Department of Health guidance on the 'Detection and management of outliers' and supersedes ICNARC’s previous policy.
Potential quality indicators
The Case Mix Programme (CMP) is the national, comparative audit of patient outcomes from adult, general critical care.
Potential outliers are assessed on the following quality indicators:
Hospital mortality
- Hospital mortality is defined as death before ultimate discharge from acute hospital
- A mortality ratio is calculated by dividing the observed by the expected acute hospital mortality, with the expected estimated by a risk prediction model, a mortality ratio is one (1.0) when the observed and expected acute hospital mortality are equal
- The ICNARC model was developed and validated using Case Mix Programme (CMP) data and is regularly recalibrated to ensure accuracy
- The ICNARC risk prediction model describes the relationship between case mix factors (from the first 24 hours following admission to a critical care unit) and hospital mortality
- The ICNARC model estimates the expected number of acute hospital deaths for a given critical care unit based on the case mix of its admissions
Non-clinical transfers (out)
- Critical care unit survivors discharged for comparable critical care to a Level 3 bed in an adult ICU or ICU/HDU in another acute hospital – reported as the percentage of all critical care unit survivors
- The comparator value is the overall percentage of non-clinical transfers (out) from all critical care units in the CMP for the time period of the report
Unplanned readmissions within 48 hours
- Critical care unit survivors discharged to a location within the same hospital but subsequently readmitted to the critical care unit within 48 hours, and the subsequent admission classified as unplanned – reported as the percentage of all critical care unit survivors discharged to a location within the same hospital
- The comparator value is the overall percentage of unplanned readmissions within 48 hours in all critical care units in the CMP for the time period of the report
Out-of-hours discharges to the ward
- Critical care unit survivors discharged from a unit to a ward in the same hospital, out-of-hours (between 22:00 and 06:59) – reported as the percentage of all unit survivors discharged to a ward in the same hospital
- The comparator value is the overall percentage of out-of-hours discharges to the ward in all critical care units in the CMP for the time period of the report
Out-of-hours discharges to the ward (not delayed)
- Critical care unit survivors discharged from a unit to a ward in the same hospital out-of-hours (between 22:00 and 06:59) who are not delayed i.e. not declared fully ready for discharge by 18:00 on that day – reported as the percentage of all unit survivors discharged to a ward in the same hospital
- The comparator value is the overall percentage of out-of-hours discharges to the ward (not delayed) in all critical care units in the CMP for the time period of the report
Key information
The following criteria are considered when assessing potential outlier status:
Coverage
- Data are collected according to the scope of the national clinical audit
Sample size
- Presentation of quality indicators takes account of the available sample size from each participating site
Data completeness
- Comprehensive processes are in place to maximise completeness of data in all fields
Data validity
- Data are collected to a set of standard definitions and are rigorously validated to identify potential unusual, inconsistent and/or invalid values (or combinations of values)
Model accuracy
- Risk models are evaluated for their discrimination (ability to separate those that experience an event from those that do not) and calibration (agreement between observed and expected values) and are regularly recalibrated to ensure ongoing fit to up-to-date data
Quality indicators are presented in a funnel plot format, plotting the quality indicator against the number of eligible patients.
Potential outliers are defined as results that fall at least two standard deviations above the expected comparator value. Results that lie outside this threshold are said to exhibit special cause variation: the observed results in these units being different to that predicted by the model, and more so than would be expected to occur by chance (expected in 2.5% of results). This difference may be due to a number of different factors, including the data and the model, and should not, on its own, be taken as a marker of quality.
The reason for any differences should be investigated.
This policy is based on Department of Health guidance on the detection and management of outliers. Should you wish to review this policy, please follow the link below
Department of Health: Detection and management of outliers - guidance (external link)
http://www.dh.gov.uk/en/Publicationsandstatistics/Publications/PublicationsPolicyAndGuidance/DH_123589
Guidance
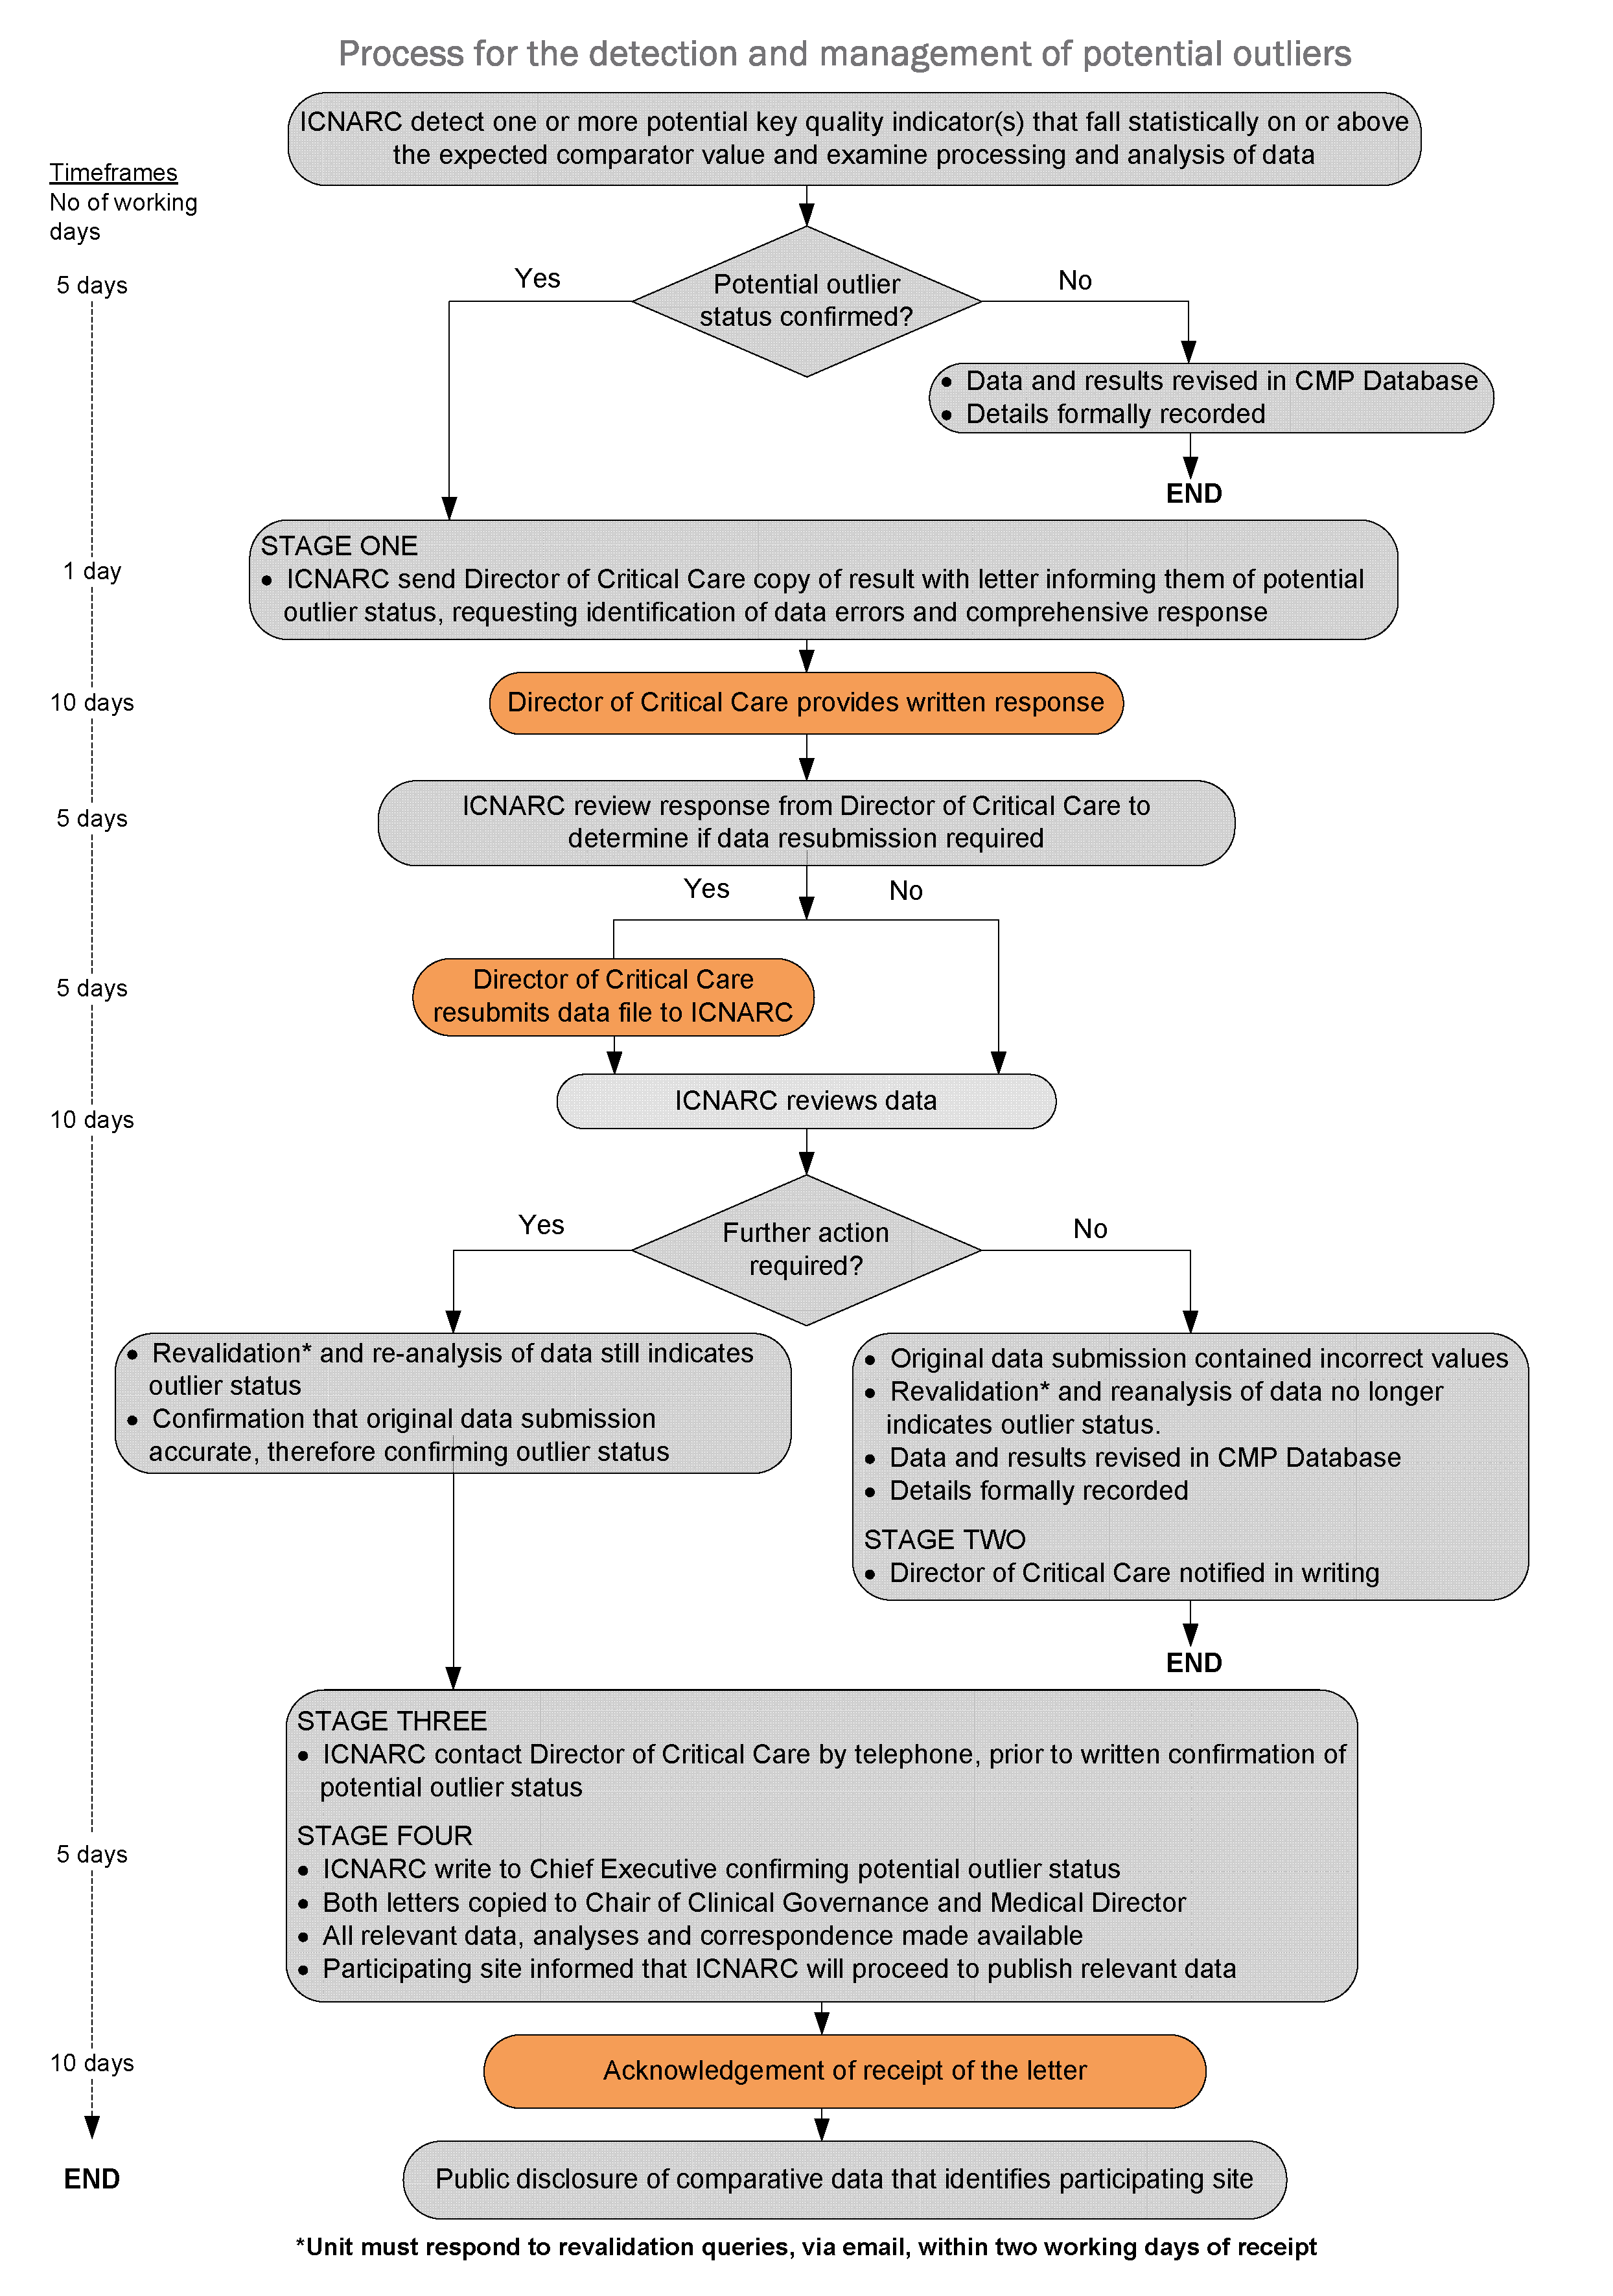
Timeframes
The flow diagram below outlines the actions and timeframes that are required in the process of detecting and managing a potential outlier.
Should a site fail to meet the timeframes set in this policy (see: flow diagram), resulting in the process not being completed by the date of publication, ICNARC will consider publication of results in the absence of a response. Publication of results will carry a notice denoting that the data are subject to an ongoing investigation under the terms of this policy.
Key individuals
Those key individuals that will or may be involved or hold some responsibility in the process of detecting and managing outliers are listed below: